Colour reduction with k-means
September 03, 2019Reducing an image down to its most dominant colours gives us a good sense of its unique colour palette, and can also produce some aesthetically-pleasing results.
To find the dominant colours in an image, we can use a technique called K-means clustering. We'll use the RGB colour space to represent colours, so we can think of each colour as 3 numbers representing the amount of red, green, and blue respectively1. This allows us to do things like calculate the distance from one colour to the next, or average the colours.
To find the K dominant colours in an image, the process is basically:
- Start with K randomly generated colours - we'll call these the centroids
- Group every colour in the image by matching it with the centroid it's closest to - we'll call these groups clusters.
- Calculate new centroids by finding the average colour in each cluster.
- Repeat the grouping and averaging process until the centroids stabilize.
(The RGB colour space doesn't necessarily match up well to how we perceive colours, the LAB space might do a better job.)
I've implemented this process below. Each time, we start with a random set of centroids. Click the "Update centroids" button to carry out one step of the K-means algorithm, which will automatically update the colour maps and images below. Keep clicking to see how To start over, click the "New random centroids" button (just mapping the images to these random centroids can give great-looking results on its own).)
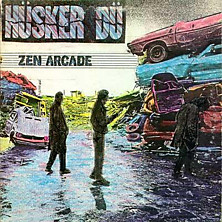
We'll calculate colours from an original source image:
- Number of centroids (K):
The current centroids:
Their hues: (These are only approximate, we're trying to visualize 3 dimensional colours in 1 dimension, and when colours get close to black their hues are a bit arbitrary)
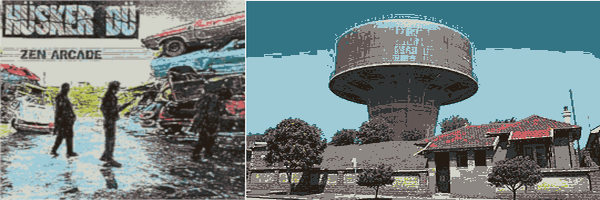
The image reduced down to its dominant colours:
Applying the same palette to another image:
(photo credit: Petersham Reservoir by OzRocky, CC-BY-SA)